
How to Measure Reusable Program Success & Prove ROI

March 26, 2026
A reusable container isn't automatically better for the planet. Each one has an upfront environmental footprint from manufacturing, and it must be used multiple times to become the greener choice. This "environmental breakeven point" is the critical threshold every program must cross to make a real difference. If your containers are only being used a few times before they disappear, you might not be achieving the positive impact you intended. This is why learning how to measure reusable program success is non-negotiable. It's about tracking the metrics, like reuse and return rates, that confirm you've surpassed that breakeven point and are generating real, quantifiable environmental benefits for your campus.
Key Takeaways
- Focus on Reuse Frequency, Not Just Quantity: A program's true value comes from how often each container is used, not just how many you own. Aim for each container to be used at least 7 to 10 times to ensure you're achieving real cost savings and environmental benefits.
- Automate Tracking for Effortless Accountability: Manual tracking is inefficient and prone to error. An integrated tech system with unique container IDs and smart return bins provides the accurate, real-time data needed to automate accountability and achieve high return rates without burdening your staff.
- Turn Your Data into Actionable Insights: Regularly review your program's analytics to understand user behavior and identify opportunities for improvement. Use this information to refine your operations and create transparent reports that prove your program's value to stakeholders.
What Metrics Define a Successful Reusables Program?
To truly understand if your reusables program is working, you need to look beyond simple container counts. A successful program is defined by a blend of financial health, environmental performance, and user satisfaction. Think of it less like a checklist and more like a balanced scorecard. Are you saving money? Are you making a real dent in your campus's waste? And critically, are students and staff actually using the system? Tracking the right metrics gives you the data to prove your return on investment, secure ongoing support from leadership, and make smart decisions to improve your operations. A tech-enabled reuse system provides the data you need to measure what matters most. By focusing on a few key performance indicators, you can paint a clear picture of your program's value and build a powerful case for its long-term success.
Understanding Reuse Rates
The single most important metric for any reusables program is the reuse rate. This number tells you the average number of times one container is used before it's lost, broken, or retired. It's the true measure of circularity. A program with thousands of containers is only effective if each one is in constant circulation. Instead of just asking how many containers you have, the better question is, "How often is each container being reused?" A high reuse rate is what drives both your cost savings and your environmental impact. It confirms that your inventory is working hard for you, not just sitting on a shelf or ending up in a dorm room. This metric is a direct reflection of your program's efficiency and user adoption.
Tracking Return Rates
You can't reuse what you don't get back. That's why the return rate, the percentage of containers that are returned after checkout, is so critical. This metric is directly linked to your reuse rate and the overall financial viability of your program. To achieve a reuse rate of 10 times per container, for example, you need a consistent return rate of 90% or higher. Low return rates mean you're constantly spending money to replace lost inventory, which undermines the cost savings you're supposed to achieve. A high return rate indicates that your system is convenient, your users are engaged, and your accountability measures are effective. It's a key indicator of a healthy, sustainable program that can maintain itself without constant cash infusions for new containers.
Analyzing Cost Savings
A well-run reusables program should save you money over time. The most direct way to measure this is by analyzing your cost savings against what you would have spent on single-use packaging. Start by calculating your total program cost, including containers, technology, and any operational expenses. Then, compare that to the fluctuating and often rising costs of disposable containers. This calculation reveals your direct ROI. For many institutions, the savings are substantial, especially as the price of paper and plastic goods continues to increase. This financial data is one of the most compelling arguments you can present to stakeholders to demonstrate the program's value and justify the initial investment.
Measuring Environmental Impact
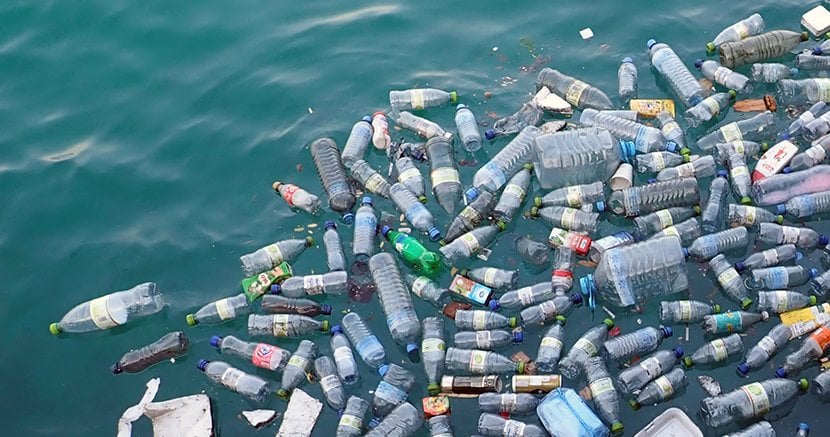
Beyond the budget, a primary goal of any reuse initiative is to reduce waste. Measuring your environmental impact provides tangible proof that your program is meeting its sustainability goals. Key metrics include the total number of single-use containers avoided, the reduction in landfill waste (measured in weight or volume), and the associated decrease in carbon emissions and water usage. This data transforms your program from a simple operational change into a powerful story about your campus's commitment to the environment. These impact metrics are perfect for sharing in sustainability reports, marketing materials, and campus communications to build community pride and encourage even greater participation.
Gauging User Engagement
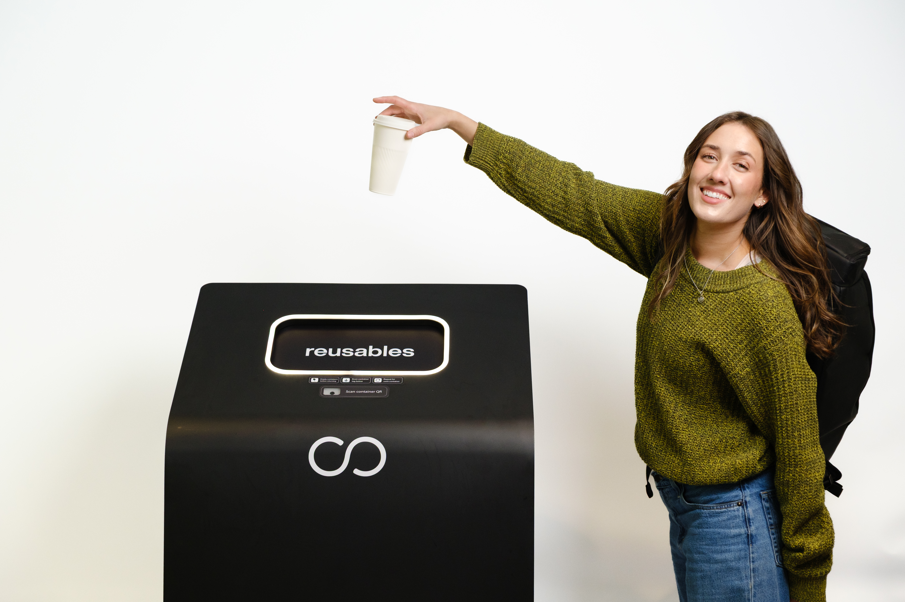
Even the best-designed system will fail if people don't use it. That's why gauging user engagement is essential. This involves tracking metrics like the total number of users, the percentage of the campus population that has opted in, and how frequently individuals use the service. For a program to succeed, it must be incredibly simple and fit seamlessly into a student's daily routine. A frictionless experience is non-negotiable. Low adoption or infrequent use can signal that there are barriers to participation, such as a complicated sign-up process or inconvenient return options. By monitoring engagement, you can identify these friction points and make adjustments to create a program that students and staff genuinely want to use.
How to Effectively Track and Analyze Reuse Rates
To truly understand your program's performance, you need to move beyond simple container counts. Effective tracking gives you the hard data to prove ROI, streamline your operations, and make smart decisions for the future. It's about turning your reuse initiative into a well-oiled, data-driven system. Here's how to set up a tracking process that delivers clear, actionable insights.
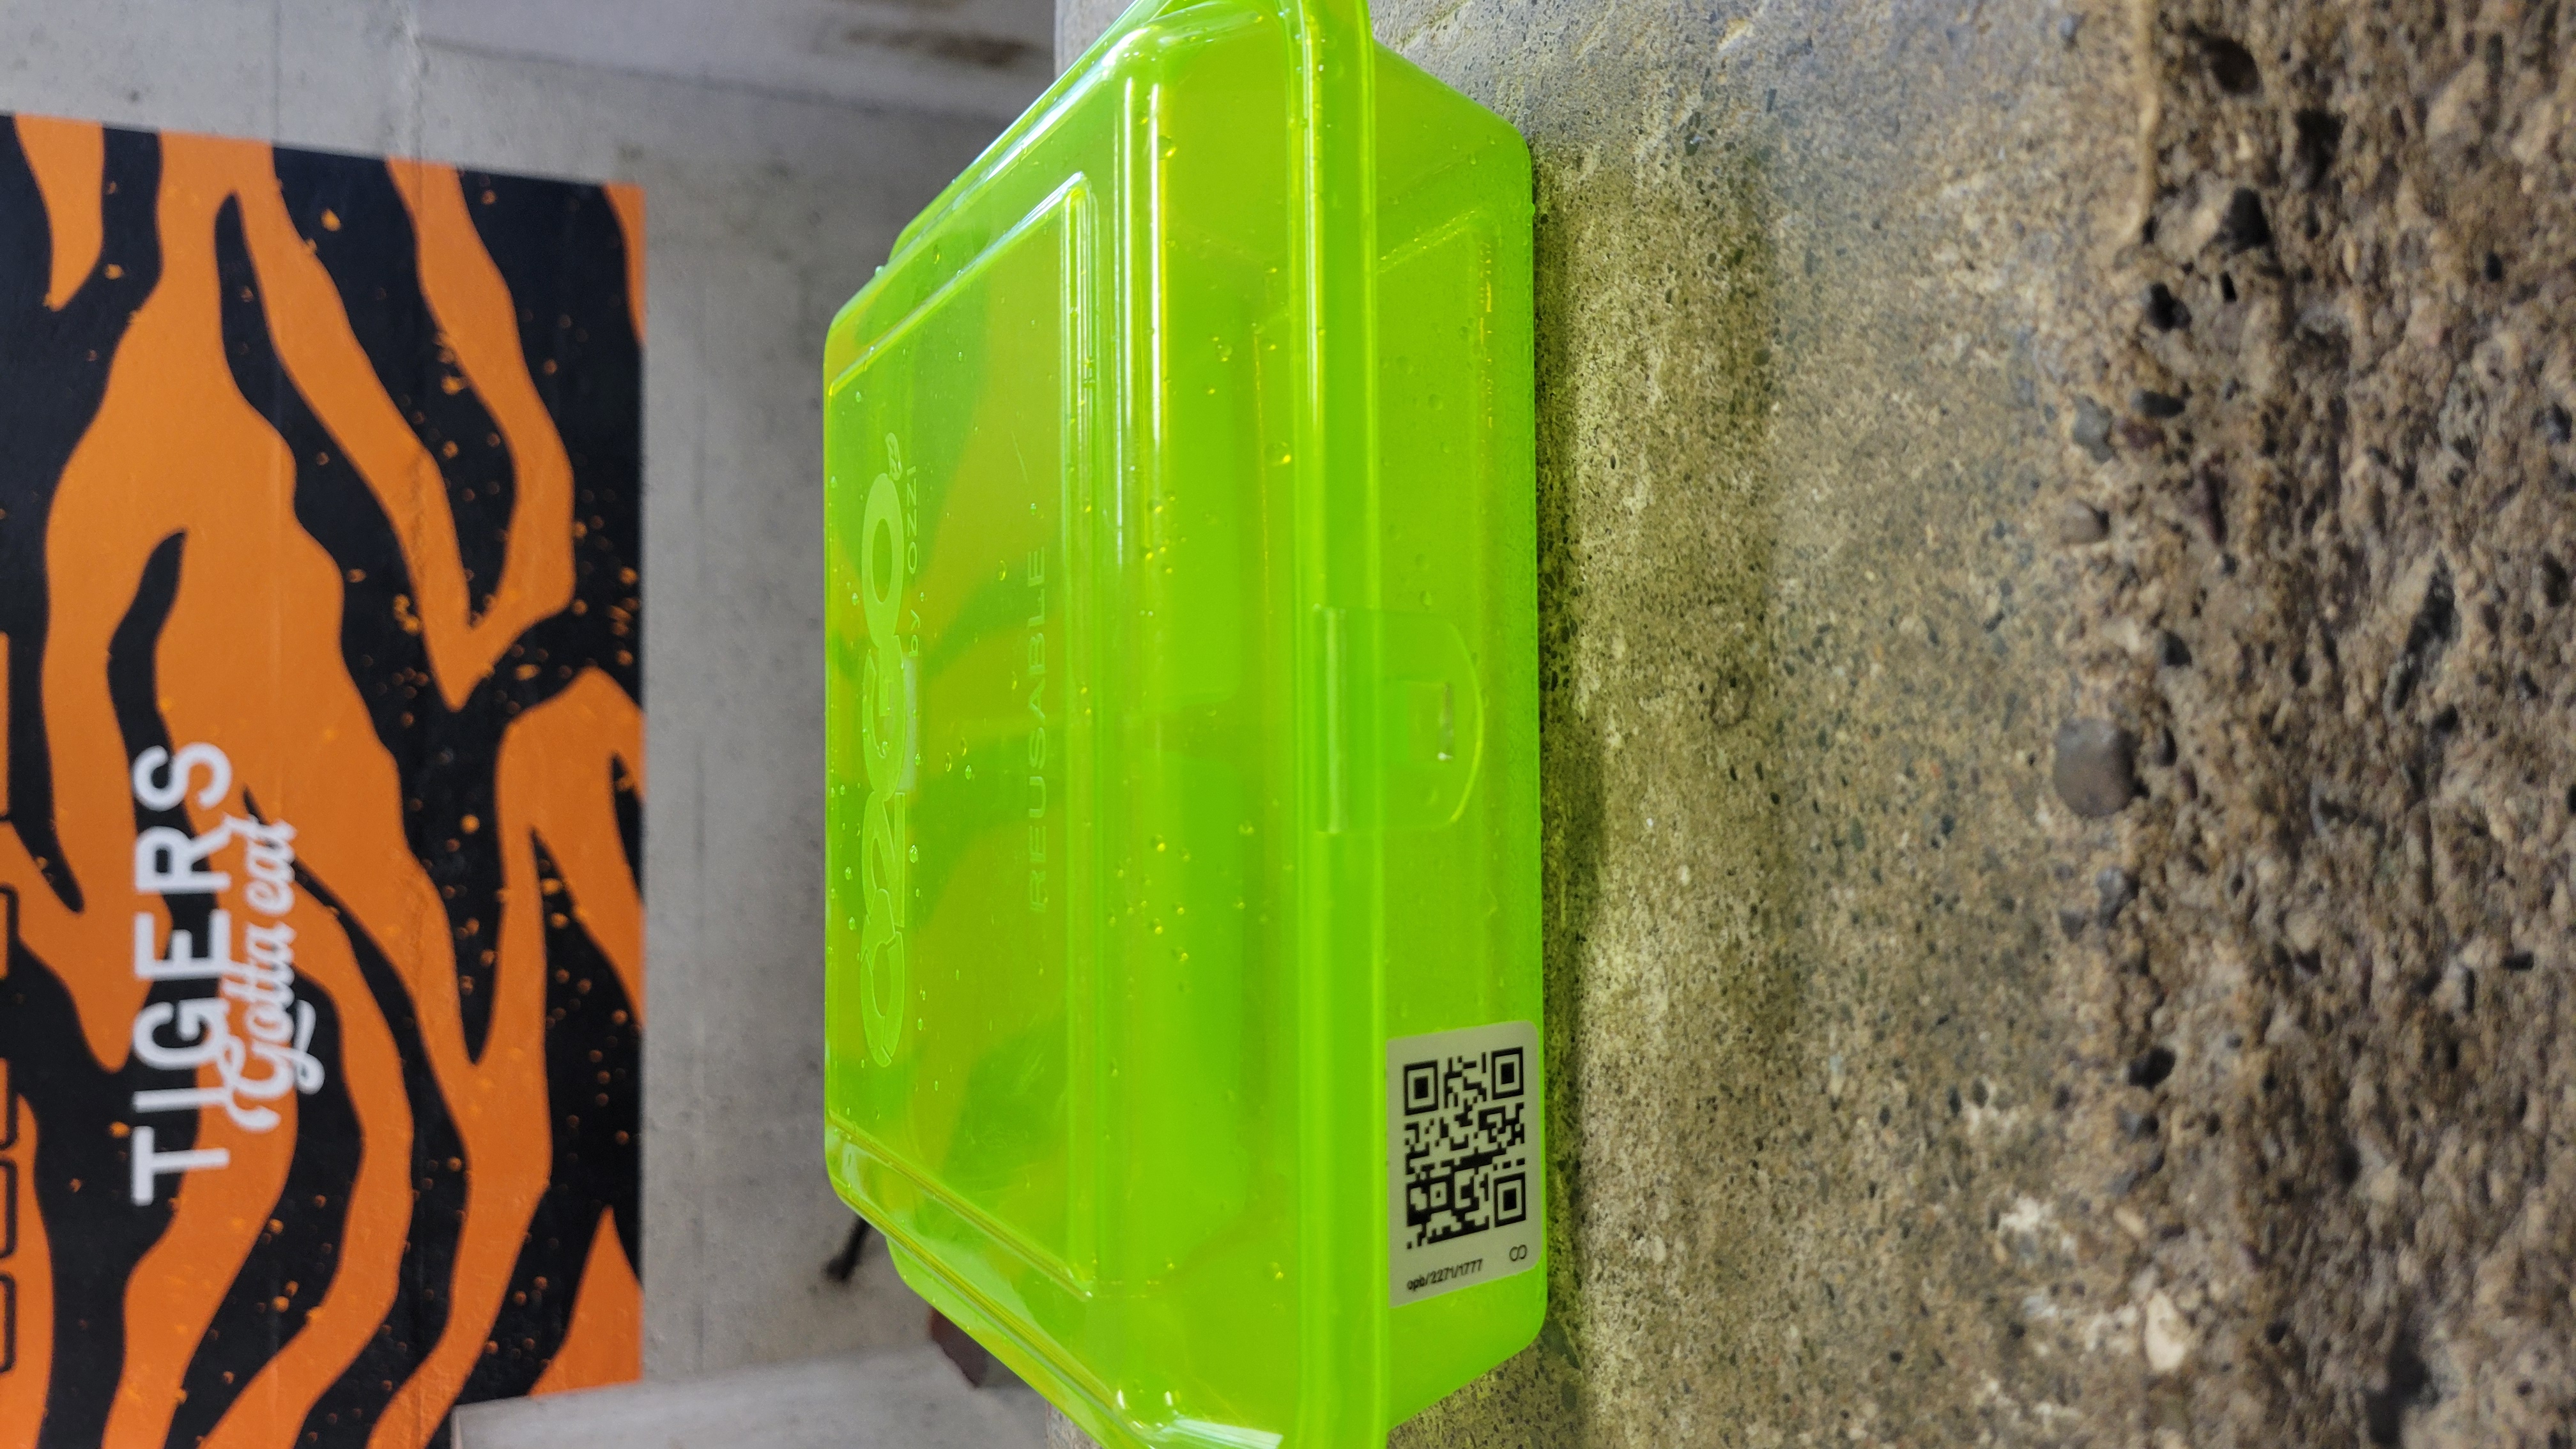
Use Digital Tracking and RFID
Forget manual tallies and honor systems. The foundation of a successful reusables program is accurate, automated tracking. Each container needs a unique digital identity, typically through a QR code or an RFID tag. This allows you to follow its entire journey, from checkout to return and washing. Implementing a robust digital tracking system eliminates guesswork and provides a precise count of how many times each container is used. This level of detail is impossible with manual methods and is essential for gathering the data you need to measure your program's true impact and efficiency.
Collect Data in Real-Time
Data that's a week old can't help you with today's lunch rush. Real-time data collection is critical for managing your container inventory and operations effectively. Your dashboard should show you exactly what's happening right now: how many containers are in circulation, which dining halls are running low, and which return bins are nearing capacity. This live visibility allows your team to be proactive instead of reactive. You can restock containers before a shortage occurs and schedule bin collections efficiently, ensuring a smooth experience for students and staff. This approach transforms your data from a historical record into a powerful operational tool.
Set Up Automated Monitoring
Your team has enough on its plate without having to chase down unreturned containers. An automated monitoring system handles the tedious but essential follow-up for you. The system should automatically send reminders to users with overdue items and manage any associated late fees without requiring manual intervention from your staff. This not only ensures high return rates but also frees up your team's time. Similarly, the system can send alerts when return bins are full or require service. Automated monitoring turns accountability into a background process, making the entire program more efficient and self-sustaining.
Follow Best Practices for Data Accuracy
Your insights are only as reliable as your data. To ensure accuracy, start with a solid foundation. Every container and user must have a unique, trackable ID within the system. It's also crucial to have reliable, purpose-built hardware, like smart return bins and scan stations, that captures every transaction without errors. When a tracking solution is implemented correctly, it empowers you to take control of your program, foster engagement, and confidently report on your financial and environmental wins. Clear instructions for users at checkout and return points will also minimize confusion and support clean data collection from day one.
What's the Minimum Reuse Threshold for Environmental Benefits?
Switching to reusables feels like an instant environmental win, but the real benefits don't kick in on day one. Every reusable container has an upfront environmental footprint from its manufacturing and transportation. To make your program truly sustainable, you have to use each container enough times to overcome that initial impact and start generating positive results. This is where the concept of a "breakeven point" comes in. It's the specific number of reuses needed for a container to become a better choice than its single-use alternative.
Hitting this target is the first major milestone for any successful reuse program. It's the proof point that shows your investment is paying off for the planet. Without tracking this, you're operating on assumptions rather than data, and you can't be certain your program is making the difference you intend it to.
Find Your Environmental Breakeven Point
So, what's the magic number? While it can vary slightly based on container material and logistics, a good rule of thumb is that a reusable container needs to be used between 7 and 10 times to outperform a single-use option. Think of this as your environmental breakeven point. Until a container hits its seventh use, you haven't quite offset its initial impact. After ten uses, you are well into generating clear environmental benefits. This target gives you a concrete goal to build your program around and a key metric to report to stakeholders.
Calculate the Lifecycle Impact
Knowing you need 7 to 10 uses is one thing; achieving it is another. This goal is directly tied to your return rate. To understand the full lifecycle impact of your containers, you need to connect these two metrics. To consistently hit at least 7 uses per container, your program needs an average return rate of 86%. To reach 10 uses, you'll need to maintain a return rate of 90% or higher. This shows why a high return rate isn't just a "nice-to-have." It's the engine that drives the environmental success of your entire system.
Know the Reuse Requirements for Different Materials
A common pitfall is settling for what seems like a decent return rate. For example, a rate of 67% might not sound too bad, but it results in an average of only three uses before a container is lost. This falls far short of the environmental breakeven point, meaning the program may not be delivering any real sustainability benefits. Whether you're using stainless steel or durable plastic, the principle is the same: high reuse is essential. This is why focusing on a complete zero-waste packaging system that guarantees high return rates is critical for success.
How to Measure Your Program's Cost-Effectiveness
Moving to a reusable system is a big decision, and proving its financial value is just as important as highlighting its environmental benefits. A successful program doesn't just reduce waste; it makes smart financial sense for your campus. When you look past the initial investment, you'll often find that reusables can significantly cut long-term operational expenses. The key is to look at the complete financial picture, from the obvious costs of disposable containers to the hidden expenses that eat into your budget over time. By carefully measuring cost-effectiveness, you can build a powerful case for your program and demonstrate its long-term value to stakeholders.
Compare Costs: Reusables vs. Single-Use
At first glance, a single disposable container seems inexpensive. But when you multiply that small cost by thousands of meals served each day, the numbers add up quickly. With the cost of disposable packaging rising, sticking with single-use items means accepting a recurring and increasing operational expense.
To make a fair comparison, calculate the breakeven point for your reusable containers. This is the number of times a container must be used for its cost-per-use to become lower than the cost of a single-use alternative. For many programs, this number is surprisingly low. Remember to factor in the full cost of disposables, including shipping, storage, and the fees you pay for waste hauling, which can be substantial.
Uncover Hidden Operational Costs
Every system has operational costs, but they aren't always obvious. For reusables, you need to account for the resources required to keep the system running. This includes everything from water and energy for washing to the labor needed for collecting, sorting, and inspecting containers. A clear understanding of these expenses is essential for an accurate financial assessment.
At the same time, single-use packaging comes with its own set of hidden costs. Think about the staff time spent managing overflowing trash bins, reordering stock, and handling inventory. A tech-enabled reuse system can streamline many of these tasks. For example, smart return bins and automated tracking reduce the manual labor needed to manage inventory and collect containers, making the whole process more efficient.
Calculate Your Return on Investment (ROI)
While a reusable program requires an upfront investment in containers and technology, it can deliver significant savings over time. Calculating your return on investment helps you quantify that value. The basic idea is to compare the money you save by not buying disposables against the cost of running your reuse program.
Start by calculating your annual savings on single-use packaging. Then, subtract the annual operational costs of your reusable system (like washing and maintenance). Divide that number by your initial investment to find your ROI. Many institutions find that the program pays for itself within a few years and continues to generate savings long after. This powerful metric clearly demonstrates the long-term financial wisdom of switching to reusables and helps you build a business case for the program.
Analyze the Total Cost of Ownership
The initial price of a reusable container is only one part of its overall cost. To get the full picture, you need to analyze the total cost of ownership (TCO), which includes all expenses over the container's entire lifespan. This approach helps you make smarter purchasing decisions that prioritize long-term value over short-term savings.
Durable containers, like those made from stainless steel or high-quality polymers, may have a higher upfront cost but can withstand hundreds or even thousands of uses. This longevity dramatically lowers their cost-per-use. When analyzing TCO, consider the container's durability, expected lifespan, and replacement frequency. A cheaper container that needs to be replaced often can end up costing you more in the long run than a more durable, slightly more expensive option.
Common Challenges in Measuring Program Success (and How to Solve Them)
Launching a reusable packaging program is a fantastic step toward your sustainability goals, but proving its success with hard data can feel like a major hurdle. Many programs struggle because they lack the right tools to measure what truly matters. You might face challenges with collecting accurate data, understanding how students and staff actually use the containers, or integrating new technology with your existing campus systems. It's a common story: without clear metrics, it's tough to demonstrate ROI to stakeholders or even know if your efforts are making a real environmental difference.
The good news is that these challenges are entirely solvable. They aren't signs of a failing program, but rather common growing pains in the shift from a linear to a circular economy. By understanding these obstacles upfront, you can build a measurement framework that gives you clear, actionable insights from day one. Let's walk through the most frequent challenges and, more importantly, how to address them effectively.
Overcoming Data Collection Hurdles
One of the first roadblocks many teams hit is realizing that their old methods of tracking waste don't apply here. Traditional sustainability metrics often focus on recycling rates and end-of-life management, but a reuse program operates differently. We need better ways to measure how reusable packaging works in a circular economy because old methods don't capture the impact of reuse itself. Simply weighing less trash at the end of the month doesn't tell you how many times a container was used. The solution is to adopt a system designed specifically to track the entire lifecycle of your containers, not just their disposal.
Solving for User Behavior Tracking
It's not enough to know how many reusable containers you have in circulation; you need to know how often they are actually being reused. This is the key to your program's environmental and financial success. As experts point out, a reusable container can have a larger footprint than a single-use one if it isn't used enough times to reach its breakeven point. Manually tracking this is nearly impossible at scale. The only way to solve this is with technology that gives each container a unique digital identity, like a QR code or RFID tag. This allows you to follow its journey, count every use, and ensure you're getting the intended value from your inventory.
Breaking Down Tech Integration Barriers
Trying to piece together a reuse program from multiple vendors can create a tangled web of operational headaches. You might get containers from one supplier, tracking software from another, and return bins from a third. This approach often leads to data silos, clunky user experiences, and a support nightmare when things go wrong. A much smoother path is to work with a single provider that offers a complete, integrated system. An all-in-one solution that handles everything from containers and tracking to user support and marketing simplifies implementation and ensures all parts of your program work together seamlessly.
Dealing with Inconsistent Standards
Without a clear and consistent way to measure success, it's difficult to know if your program is truly effective. You might even run the risk of making things worse environmentally if containers aren't being returned and reused properly. The challenge is that there isn't a universal, mandated playbook for reuse metrics. This makes it hard to benchmark your performance against other institutions or even track your own progress reliably over time. The best way to handle this is to adopt a platform with a built-in, transparent measurement framework. Look for a partner that provides clear definitions and real-time data for key metrics like return rates, reuse rates, and environmental impact.
Key Strategies for Overcoming Measurement Challenges
The most effective strategy for tackling all these challenges is to lean on technology that provides real-time, automated data. A successful program should give you instant access to information on return rates and your direct impact on waste, water, and emissions. Instead of relying on manual counts or estimates, a tech-enabled system does the heavy lifting for you. With smart return stations, automated tracking, and a centralized dashboard, you get a live look at your program's health. This not only proves your program's value but also gives you the insights needed to continuously improve the user experience and your operational efficiency. A fully integrated system turns measurement from a challenge into a strength.
How Technology Automates Tracking and Improves Accountability
Let's be honest: manual tracking is a recipe for headaches. It's time-consuming, riddled with potential errors, and can leave you guessing about your program's actual performance. This is where technology steps in to completely change the game. By automating the tracking process, you get accurate, real-time data that makes accountability nearly effortless for both your team and your users.
Automated systems handle the entire lifecycle of a reusable container, from checkout to return, without requiring manual data entry. This not only frees up your staff but also provides the concrete numbers you need to prove ROI and achieve those impressive 99% return rates. The right reuse platform gives you the tools to see what's working, identify areas for improvement, and confidently report on your success.
Leverage Smart Bins and Scanning Stations
The foundation of a strong, accountable reuse program is knowing where your containers are at all times. Smart bins and scanning stations are your eyes on the ground, making manual counts a thing of the past. Each reusable container is tagged with a unique QR code or RFID chip. When a user returns a container to a smart bin, it's automatically scanned and logged in the system, giving you an instant inventory update.
This technology does more than just count. Smart bins can send alerts to your staff when they're getting full, streamlining collection routes and improving operational flow. This enhanced monitoring provides real-time data that helps you manage your inventory effectively and ensures a smooth, reliable experience for users, which is key to keeping them engaged.
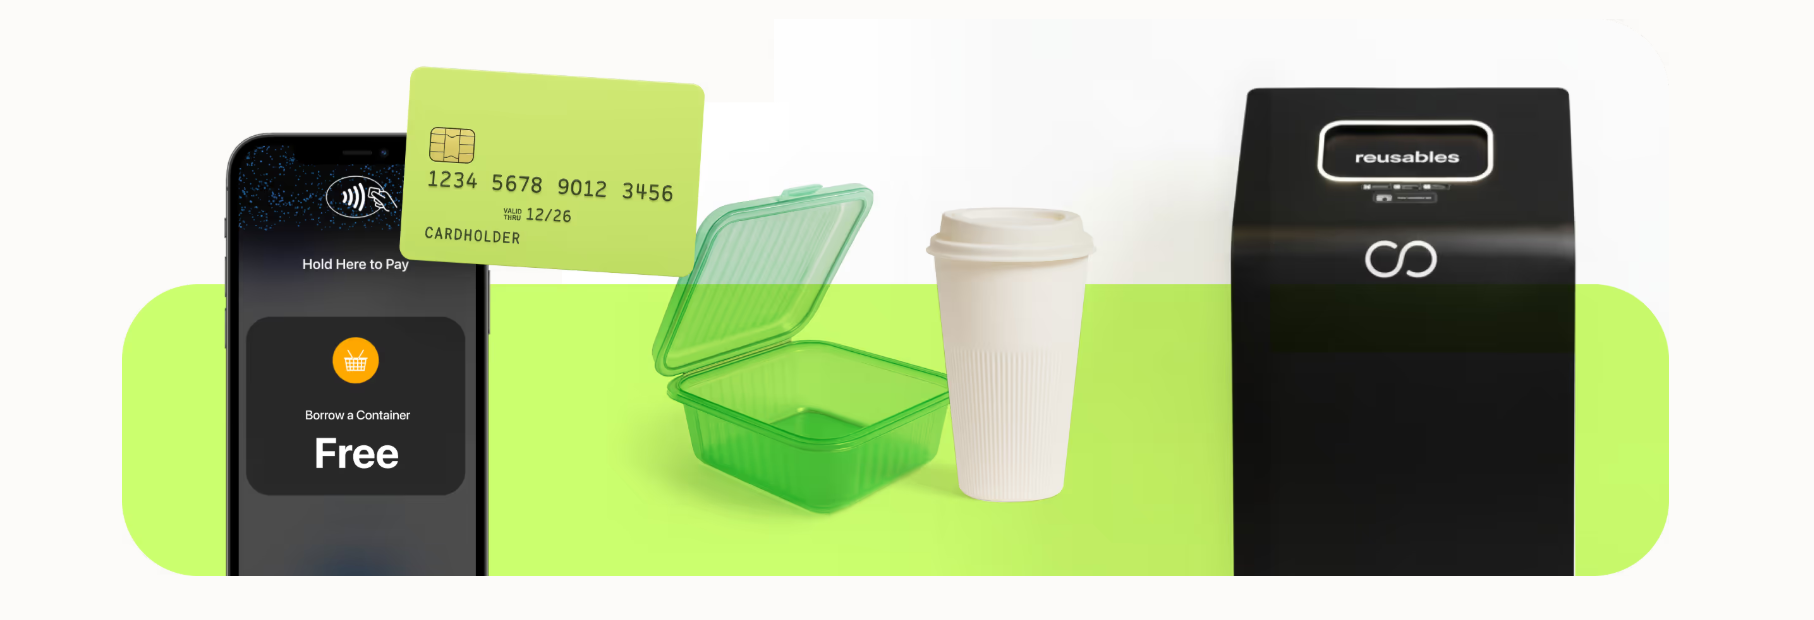
Integrate with Campus Card and Payment Systems
The easiest way to get students on board is to make participation seamless. Integrating your reusables program with existing campus card and payment systems eliminates the need for users to download a separate app or carry another card. They can simply tap their student ID or credit card to check out a container, linking that specific item to their account in seconds.
This integration is the linchpin of accountability. Because each container is tied to a user, the system can automatically send reminders if an item is overdue. This simple step dramatically increases return rates without creating extra work for your staff. Technology can be a powerful tool for encouraging personal accountability by making the process clear and easy to follow.
Use Automated Reports and Alerts
Once you're collecting all this great data, you need an easy way to make sense of it. Automated reporting tools do the heavy lifting for you, transforming raw data into clear, actionable insights. Instead of spending hours in spreadsheets, you can get instant reports on key metrics like reuse rates, return times, and peak usage periods. This allows you to spend your time making strategic decisions, not crunching numbers.
These systems can also provide critical operational alerts. Imagine getting a notification when your container inventory at a specific dining hall is running low. This proactive approach helps you prevent stockouts and ensures the program runs smoothly. Having access to timely, automated compliance reporting also makes it simple to share progress with stakeholders and demonstrate the program's value.
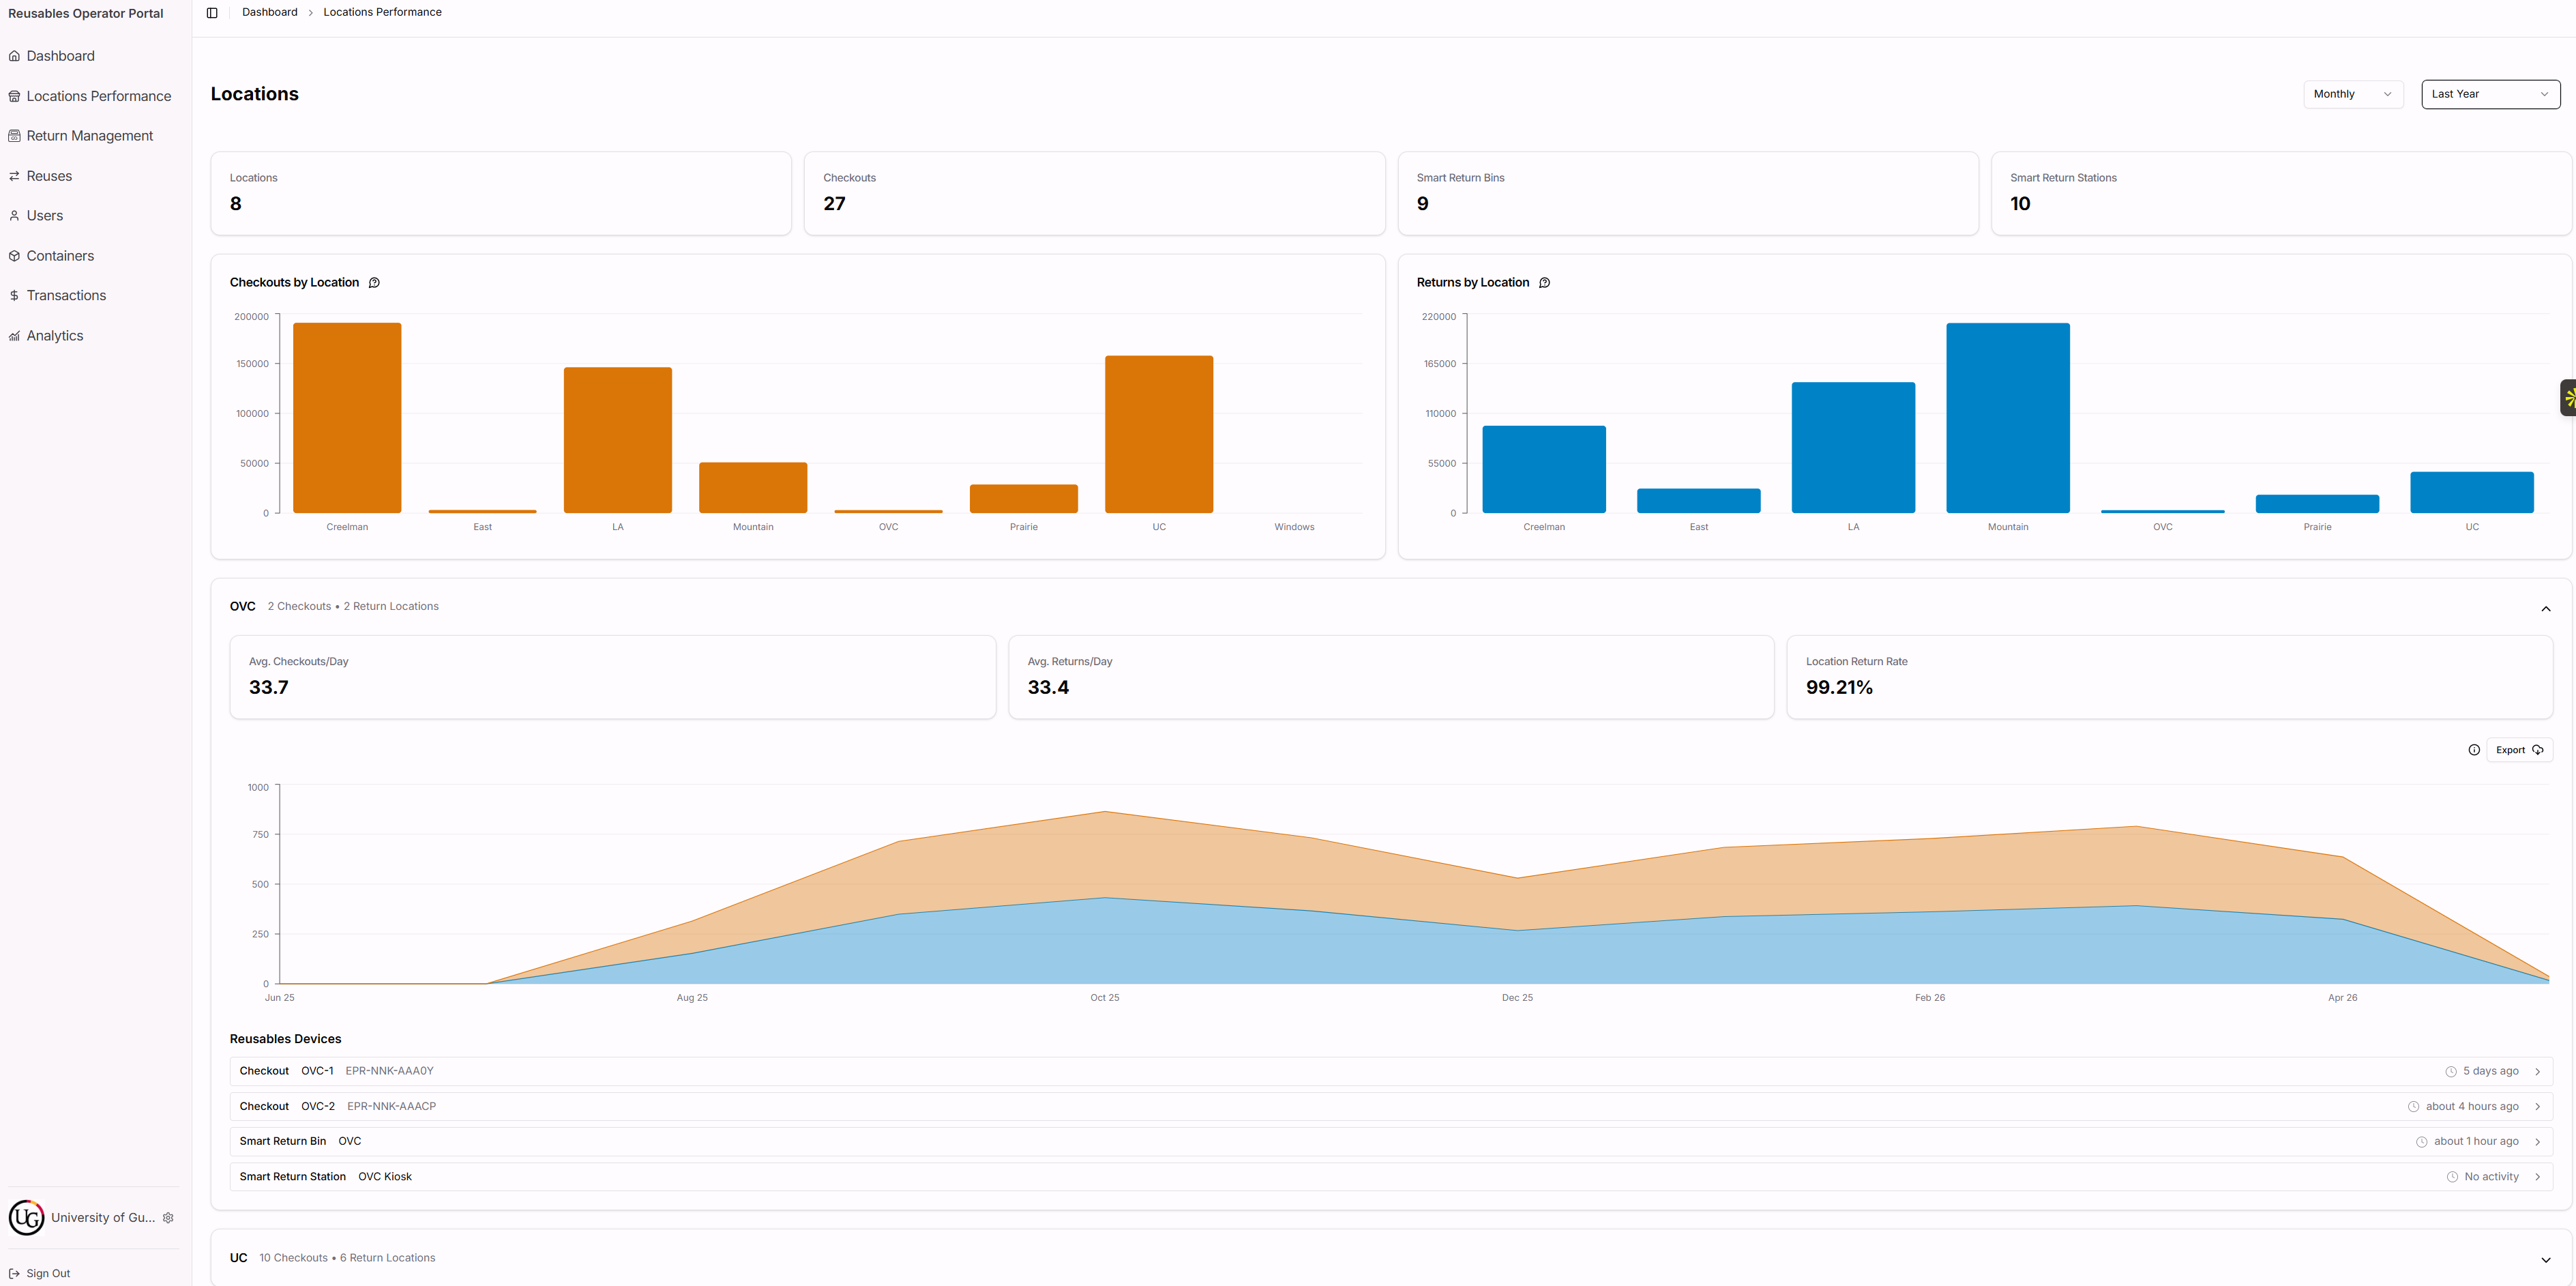
Create Dashboards for Real-Time Visibility
A centralized dashboard brings all your program data together into one intuitive, visual hub. This gives you and other stakeholders a live look at performance, from overall environmental impact down to the return rate at a single location. With real-time visibility, you can spot trends as they happen and make informed decisions on the fly.
This level of transparency is essential for building trust and demonstrating success. When you can easily show cost savings, waste reduction, and user engagement metrics, you build a stronger case for the program's continuation and expansion. Using digital tools to increase accountability ensures everyone is on the same page and working toward the same sustainability goals.
Use Performance Data to Continuously Improve Your Program
Launching your reusables program is a huge accomplishment, but it's just the beginning. The real success comes from what you do next. Think of your program data as more than just a report card to show stakeholders; it's a roadmap for continuous improvement. By regularly digging into your performance metrics, you can move from simply running a program to actively refining it. This is how you turn a good initiative into a great one that students love, that runs smoothly for your staff, and that delivers an even stronger return on investment.
Data helps you understand the real-world behavior of your users. It shows you where things are working perfectly and where there might be friction. Are students consistently returning containers to one bin but not another? Is there a drop-off in usage after the first few weeks of the semester? These are the kinds of questions your data can answer, allowing you to make smart, targeted adjustments. Instead of guessing what might work better, you can make informed decisions that enhance the user experience, streamline operations, and maximize your environmental impact. This proactive approach ensures your program not only meets its goals but continues to evolve and improve over time.
Find Opportunities in Your Analytics
Your analytics dashboard is one of the most powerful tools you have. It provides the essential data you need to see how the program is working, find ways to improve it, and demonstrate your campus's commitment to sustainability. Look beyond the top-line numbers and search for patterns and outliers. For example, if you notice that one dining hall has significantly lower participation rates, it could signal a need for better signage or a quick training session for the staff at that location. If you see that return bins fill up at the same time every day, you can adjust your collection schedule to prevent overflows and keep the system running smoothly. Your real-time data is a goldmine of insights waiting to be uncovered.
Adjust Program Details Based on Metrics
Once you've identified an opportunity in your analytics, you can use specific metrics to guide your adjustments. This is about moving from observation to action. For instance, if your overall return rate is high but you notice a lag in returns from a particular residence hall, you can dig deeper. Maybe the closest return bin isn't in a convenient, high-traffic location. A simple change, like moving the bin closer to the main exit, could make a significant difference. This paper on key metrics for reusable packaging highlights the importance of using targeted measurements to track performance. By focusing on specific, actionable metrics, you can make small changes that lead to major improvements in your program's efficiency and success.
Optimize Based on Usage Patterns
It's easy to focus on how many containers are checked out, but a more telling metric is how often each container is actually being reused. A container that's only used once or twice before it goes missing isn't delivering on its environmental or financial promise. As experts at Returnity point out, we need to ask "'how often' they are reused," not just "'how many' are out there." Tracking the lifecycle of your containers helps you understand their true utilization. This data allows you to optimize your inventory, ensuring you have enough of the most popular container types in circulation. It also helps you spot and resolve bottlenecks where containers might be getting stuck, keeping your assets working for you.
Implement a Feedback Loop
Data tells you what's happening, but student feedback often tells you why. Combining your quantitative performance data with qualitative feedback from users creates a powerful loop for improvement. If your data shows that students are holding onto containers for longer than you'd like, a simple survey could reveal the reason. Maybe they forget to bring them back, or perhaps they find the return process confusing. Creating easy ways for students to share their thoughts, like a QR code on return bins that links to a feedback form, can provide invaluable insights. This approach not only helps you refine the program but also makes students feel like valued partners in your campus's sustainability efforts, which can build a stronger community around your initiative.
How to Benchmark Your Program Against Industry Standards
Once your reusable packaging program is up and running, you need a way to gauge its performance. Benchmarking helps you understand how your efforts stack up against established industry standards. It's not about just collecting data; it's about using that data to see the bigger picture, identify areas for improvement, and prove the value of your investment. By comparing your program to others, you can set meaningful goals, celebrate your wins, and make strategic adjustments to ensure long-term success.
Think of it as a report card for your reusables initiative. Are you hitting the marks needed to achieve real environmental and financial benefits? Without clear benchmarks, you're essentially flying blind. A solid benchmarking strategy gives you the context to answer that question confidently and provides a roadmap for continuous optimization. It transforms raw data into a powerful story about your campus's commitment to sustainability and operational excellence.
Establish Your Baseline
Before you can measure progress, you need to know your starting point. Establishing a baseline is the first critical step. This isn't just about counting how many reusable containers you have in circulation. The most important metric is how frequently each container is actually being used. As the team at Returnity points out, "Instead of just asking 'how many' reusable packages are out there, we need to ask 'how often' they are reused." This shift in focus from quantity to frequency gives you a much more accurate understanding of your program's real-world impact and efficiency from day one.
Set Realistic Performance Targets
With your baseline established, you can set clear, achievable performance targets. These goals give your team something concrete to work toward and provide a clear definition of success. So, what's a good target to aim for? Research shows that most reusable packaging needs to be used between seven to 10 times to be more environmentally friendly than its single-use counterpart. Using this range as your guide, you can set specific reuse goals for your containers that are both ambitious and grounded in industry data, ensuring your program delivers on its sustainability promises.
Compare Your Program to Others
To truly understand how your program is performing, you need to look beyond your own campus. Comparing your metrics to industry-wide data provides valuable context. However, it's important to use the right metrics. A study in Frontiers notes that many organizations need better ways to measure performance in a circular economy, as traditional methods often focus on recycling rather than reuse. This highlights the need for a system that provides comprehensive metrics reflecting the true efficiency of reusable packaging, allowing for a more accurate and meaningful comparison.
Understand Industry-Leading Return Rates
Your container reuse rate is directly tied to your return rate. After all, you can't reuse what you don't get back. So, what return rate should you be aiming for? To hit that seven-use environmental breakeven point, your program needs an average return rate of 86%. To achieve 10 uses, you'll need a 90% or higher return rate. These figures are the industry standard for a high-performing program. While they may seem high, they are entirely achievable with a system designed to encourage user participation and simplify the return process.
Earn Stakeholder Buy-In with Transparent Reporting
Getting your team and leadership excited about a reuse program is one thing; keeping them invested is another. The key is transparent, consistent reporting. When you can clearly show the program's impact with hard data, you build trust and demonstrate value in a language everyone understands. It transforms the conversation from "this feels like the right thing to do" to "this is a smart, strategic decision for our campus." Good reporting isn't just about tracking numbers; it's about telling a compelling story of success, backed by undeniable facts.
This data-driven approach helps you secure ongoing support and resources. With the right metrics, you can prove the program is not only meeting its environmental goals but also delivering real financial and operational benefits. It's how you turn a sustainability initiative into an institutional success story.
Create Comprehensive Performance Dashboards
To effectively share your program's progress, you need a central hub for all your key metrics. A comprehensive performance dashboard gives stakeholders a real-time look at what matters most: how many containers are being returned, how much waste is being diverted from landfills, and the savings in water and emissions. This level of transparency is crucial for building trust. When decision-makers can see the numbers for themselves, they gain confidence in the program's effectiveness. A robust dashboard with live data on inventory levels, return rates, and financial impact makes it easy to keep everyone informed and aligned. It takes the guesswork out of performance tracking and puts the focus on clear, measurable results.
Tailor Reports for Different Stakeholders
Not everyone on your leadership team cares about the same metrics. Your Director of Finance is focused on the bottom line, while your Sustainability Officer wants to see the environmental impact. To get buy-in from everyone, you need to tailor your reports to their specific interests. For financial stakeholders, highlight the cost savings and ROI. For sustainability teams, focus on waste reduction and carbon footprint data. For operations managers, showcase return rates and user engagement. Providing each stakeholder with the information that matters most to them shows that you understand their priorities and makes your program's success relevant to their goals. This targeted communication is far more effective than a one-size-fits-all report.
Communicate Your Environmental and Financial Wins
For a reuse program to have long-term success, it needs to win on two fronts: environmental and financial. It's essential to communicate both. While the initial investment in reusable containers might seem higher than disposables, the long-term savings are significant. You're no longer buying single-use items over and over again. Frame this as a smart investment that pays for itself. At the same time, highlight the powerful environmental story. For example, many reusable containers need to be used just a handful of times to become better for the environment than their single-use counterparts. Sharing these dual wins makes a powerful case for your program's value and helps you build a strong business case for continued investment.
Schedule Regular, Data-Driven Reviews
To keep your program on track and maintain stakeholder engagement, make data reviews a regular part of your routine. Don't wait for an annual report to check in on performance. Scheduling monthly or quarterly reviews creates a consistent rhythm of accountability and continuous improvement. These meetings are an opportunity to celebrate wins, identify challenges, and make data-informed adjustments to your strategy. Without clear metrics and regular check-ins, even the best-intentioned programs can lose momentum. By establishing a routine for reviewing performance, you ensure that your program stays effective, responsive, and aligned with its goals, keeping everyone invested in its long-term success.
Create a Measurement Framework for Long-Term Success
Launching a reusables program is a fantastic first step, but ensuring its long-term health requires a solid plan for measuring what matters. A measurement framework is your roadmap for tracking progress, proving value, and making smart decisions down the line. Without clear metrics, it's difficult to know if your program is truly succeeding or just treading water. Setting up this framework from the start helps you tell a compelling story with data, whether you're reporting to leadership, applying for grants, or simply sharing your wins with the campus community.
Think of it as the foundation upon which your program grows. A strong framework moves you from anecdotal feedback to hard evidence, showing exactly how reusables are cutting costs and reducing waste. It provides the clarity needed to justify your investment and secure the resources to expand. As your program evolves from a small pilot in one dining hall to a campus-wide initiative, this framework will be essential for managing complexity and maintaining momentum. It's the key to building a program that not only lasts but also becomes a celebrated part of your campus culture.
Scale Your Measurement System as You Grow
What works for a 100-container pilot won't work for a 10,000-container campus-wide system. As your program expands, manual tracking with spreadsheets becomes impossible to manage and prone to errors. Your measurement system needs to scale with you. This means investing in technology that automates data collection from day one. A scalable system should give you real-time information on how many containers are in circulation, where they are, and how often they're being returned. It should also automatically calculate your savings in terms of waste, water, and emissions, providing instant impact metrics without adding to your team's workload.
Identify Long-Term Success Indicators
To understand the true health of your program, you need to look beyond initial adoption rates. The most important long-term indicator isn't just how many containers are checked out, but how often each container is reused. This shift in focus from quantity to frequency is critical. Every reusable container has an environmental breakeven point, a certain number of uses required to outperform its single-use alternative. Tracking the average reuse rate tells you if you're meeting and exceeding that threshold. These key metrics are what ultimately define your program's environmental and financial return on investment.
Establish a Process for Continuous Optimization
Data is only valuable if you use it to make improvements. Your measurement framework should include a clear process for regularly reviewing your analytics and turning insights into action. Set a schedule, perhaps quarterly, to sit down with your team and review the performance dashboards. Are there specific dining halls with lower return rates? Is user engagement dipping during certain times of the year? Use this information to make targeted adjustments, like adding a new return bin in a high-traffic area or launching a student engagement campaign before final exams. This creates a powerful feedback loop where your program gets smarter and more efficient over time.
Cut Costs with Smarter Inventory Management
Managing your inventory effectively is one of the most direct ways to control your budget. With food costs on the rise, letting ingredients expire on the shelf is like watching money go straight into the compost bin. By tightening up your inventory processes, you can reduce waste, prevent over-ordering, and get a much clearer picture of your operational finances. These strategies don't require a massive overhaul—just a smarter, more intentional approach to how you track and use the supplies you have on hand.
Adopt a "first-in, first-out" system
The "first-in, first-out" (FIFO) method is a foundational principle of good kitchen management. It's a simple concept: use the oldest ingredients before you open the new ones. Implementing a consistent FIFO system ensures that items are used well before their expiration dates, which dramatically cuts down on spoilage and waste. You can put this into practice by training your team to always place new deliveries behind existing stock in walk-ins, refrigerators, and dry storage. Clear labeling with delivery or expiration dates also makes it easy for staff to grab the right item every time.
Use software for real-time inventory tracking
Manual inventory counts are time-consuming and prone to error. Using digital tools for real-time inventory tracking gives you an accurate, up-to-the-minute view of your stock levels. This technology allows you to see what's selling, what's sitting on the shelves, and which items are approaching their use-by dates. With this data, you can make more informed purchasing decisions, prevent stockouts of popular items, and avoid wasting money on ingredients you don't need. It provides the operational visibility required to manage a large-scale dining service efficiently.
Automate reorder points to avoid overstocking
Once you have a digital inventory system in place, you can take efficiency a step further by setting automated reorder points. This feature helps maintain optimal stock levels by automatically flagging when an item is running low, preventing both overstocking and shortages. Instead of relying on guesswork, the system uses historical sales data and current inventory levels to tell you exactly when and how much to order. This prevents you from tying up your budget in excess inventory that could spoil and ensures you have exactly what you need to meet student demand.
Run regular waste audits to find savings
You can't manage what you don't measure. Conducting a regular food waste audit gives you clear insight into what's being thrown away and why. This process can be as simple as having your team track and categorize all discarded food for a week. The results often highlight specific areas for improvement, whether it's adjusting portion sizes, refining prep techniques, or finding creative uses for ingredients that would otherwise be tossed. An audit provides the hard data you need to make targeted changes that reduce waste and directly lower your food costs.
Train Your Team to Prevent Waste
Your team is your greatest asset in the fight against waste. While smart inventory systems and sustainable packaging are crucial, it's the daily habits of your staff that make the biggest difference. Investing in training empowers your team to become active participants in your cost-saving and sustainability goals. It's not about enforcing rigid rules, but about building a shared understanding of how small, mindful actions in the kitchen can lead to significant financial and environmental wins. When everyone knows the "why" behind the "what," they become more engaged, efficient, and proactive in preventing waste before it happens.
Teach proper portioning and waste reduction
Consistent portioning is one of the fastest ways to control food costs and reduce what gets left on the plate. Train your kitchen staff on standardized recipes and the correct serving utensils to ensure every dish is the same. Pre-portioning ingredients during prep not only speeds up service during busy hours but also guarantees that cooks use the right amount every time. If you notice a lot of a particular item coming back to the dish pit, it might be a sign to adjust your portion sizes. This simple feedback loop helps you fine-tune your menu, keep customers happy, and stop wasting valuable ingredients.
Standardize food prep and storage procedures
Clear, consistent procedures are the backbone of an efficient kitchen. Implementing a strict "First-In, First-Out" (FIFO) system is non-negotiable for managing your inventory. This simple method ensures that older products are always used before new ones, drastically cutting down on spoilage. Your training should cover everything from how to label and date incoming stock to the correct storage temperatures for different food types. When everyone on the team follows the same food safety and storage protocols, you reduce the risk of contamination and waste, creating a safer and more cost-effective operation.
Set up clear accountability and performance metrics
People perform best when they know what's expected of them and how their work contributes to the bigger picture. Establish clear goals for waste reduction and communicate them to your entire team. You can start by tracking key metrics, like the weight of daily food waste or the cost of spoiled inventory. Share these numbers regularly to show progress and highlight areas for improvement. This isn't about pointing fingers; it's about creating a culture of shared responsibility. When staff members understand the financial impact of waste, they are more likely to take ownership and find creative ways to be more efficient.
Define protocols for handling inventory
Your inventory is cash sitting on a shelf, so it's essential to have clear rules for managing it. Create and document protocols for every stage, from receiving deliveries to daily use. This includes verifying orders against invoices, immediately storing items in their designated places, and using digital tools to track what you have on hand. A well-defined system helps prevent over-ordering and ensures you always know what needs to be used next. By implementing a robust inventory management strategy, you can give your team the structure they need to minimize spoilage and make smarter use of your resources.
Lower Costs with Sustainable Practices
Adopting sustainable practices is more than just a good look for your campus—it's a powerful strategy for cutting operational costs. With disposable packaging prices soaring and waste management fees on the rise, aligning your dining services with green initiatives can have a direct, positive impact on your bottom line. These changes don't have to be complicated or disruptive. In fact, many sustainable shifts create more efficient, streamlined workflows for your team while meeting student demand for more environmentally-friendly options.
Start a composting program to reduce disposal fees
A significant portion of your waste management bill comes from the sheer weight of the trash you send to the landfill—and food scraps are heavy. Implementing a composting program diverts this organic waste, which can dramatically lower your disposal fees. Setting up designated bins for food scraps in your kitchens and dining halls is the first step. You can then partner with a local composting facility or even start an on-campus program. While it requires some initial training and setup, a well-run composting program turns waste into a resource and provides a clear, measurable reduction in your hauling costs.
Invest in energy-efficient kitchen equipment
Your kitchen is an energy hub, with refrigerators, ovens, and dishwashers running for hours every day. Older equipment can be a major drain on your utility budget. When it's time to upgrade, choosing ENERGY STAR-certified commercial kitchen equipment can lead to immediate and substantial savings. These appliances are designed to use less electricity, gas, and water without sacrificing performance. An energy-efficient convection oven or dishwasher might have a higher upfront price, but the reduction in your monthly utility bills means the equipment often pays for itself over its lifespan, delivering savings for years to come.
Track These Metrics to Measure Success
Once you start putting new cost-saving strategies into place, you need a way to see what's working. Tracking the right metrics gives you a clear picture of your progress and helps you make smarter decisions for the future. It's not just about seeing numbers go down; it's about understanding the why behind the changes so you can replicate your successes.
Think of these metrics as your operational dashboard. They show you where you're saving money, where you're becoming more efficient, and how your sustainability efforts are paying off. By focusing on a few key performance indicators (KPIs), you can prove the value of your initiatives to stakeholders and keep your team motivated. It's how you turn good ideas into lasting, impactful results for your dining program.
Keep an eye on food cost percentage and profit margins
Your food cost percentage—the cost of your ingredients divided by your food service revenue—is one of the most important financial health indicators you can track. Monitoring this number closely helps you see the direct impact of menu changes, supplier negotiations, and waste reduction efforts. A lower percentage means you're keeping more of every dollar you earn.
But financial metrics are only part of the story. As you work to improve profitability, it's also important to consider how your changes affect your broader sustainability goals. Sustainable food system metrics are essential tools for evaluating performance beyond just the bottom line, helping you measure environmental and social impacts alongside financial ones. This holistic view ensures your cost-saving measures are also building a more resilient and responsible operation.
Measure changes in energy and water use
Food and packaging aren't your only supply costs. Energy and water consumption can take a big bite out of your budget, especially in large-scale campus kitchens. Start by benchmarking your current usage, then track it over time as you implement changes like installing energy-efficient appliances or training staff on water conservation practices.
Monitoring these numbers helps you understand your kitchen's overall operational efficiency. While data tracking can seem complex, focusing on a few key areas like energy consumption and water usage provides clear insight into where you can cut costs. Small adjustments, from fixing leaky faucets to upgrading to ENERGY STAR equipment, can lead to significant savings that add up month after month.
Related Articles
- 5 Ways to Prevent Loss of Reusable Containers
- 7 of The Best Reuse Companies Redefining Waste
- The Best Reuse Systems: 5 Must-Have Features
- Your Guide to Transact Integrated Sustainable Dining
- Your Guide to Smart Takeout Containers for Universities
Frequently Asked Questions
What's the one metric I should focus on above all others? While several metrics are important, the reuse rate is the true measure of your program's success. This number tells you the average number of times each container is used. A high reuse rate means your containers are working hard, delivering both cost savings and environmental benefits with every cycle.
A 90% return rate seems high. How is that actually achievable? Achieving a high return rate comes down to making the process incredibly simple for users and automating accountability. When a reuse system integrates directly with campus cards and payment systems, checking out a container is effortless. Combine that with automated reminders for overdue items and convenient smart return bins, and you remove the common barriers that prevent returns. It's less about strict enforcement and more about creating a frictionless, reliable system.
How much extra work does tracking all this data create for my staff? That's a fair question, but a modern, tech-enabled system is designed to reduce your team's workload, not add to it. The tracking is automated. Smart bins and scanning stations handle the data collection, and the software manages user reminders and accountability. This frees your staff from tedious tasks like manual counts or chasing down fees, allowing them to focus on providing a great dining experience.
Beyond the cost of disposables, how do I calculate the true financial value of a reuse program? To see the full financial picture, you need to look at the total cost of ownership. This includes not only the money you save by not buying single-use containers but also the hidden costs associated with them, like waste hauling fees and the staff time spent managing trash and reordering stock. When you compare these ongoing expenses to the one-time investment in a durable, long-lasting reuse system, the long-term financial benefits become very clear.
Once I have all this data, what's a simple way to use it to make the program better? Your data dashboard is your best tool for continuous improvement. For example, you might notice in your analytics that a return bin near a specific dorm is consistently underused. This insight allows you to investigate why. Perhaps the bin is in an inconvenient spot. By moving it to a higher-traffic area, you can make a small, data-informed adjustment that improves the user experience and boosts your return rates.
Other stories you may find interesting

.png)

.avif)


.webp)


Watch the Webinar
Learn How to Eliminate Single-Use Waste
Get instant access to our expert webinar and discover how leading institutions reach 99% return rates through smarter reuse systems.
© Reusables™. All rights reserved.