
Stories

Why Return Rate Decides Whether a Reuse Program Works

November 12, 2026


Reusable containers are often described as the sustainable choice by default. The evidence supports something more conditional.
A durable container starts life with a larger footprint than the single-use item it replaces: more material, more energy to manufacture, and ongoing washing and transport. It pays that back only by being used again, many times. Whether that happens comes down to one figure: return rate.
What return rate measures
Return rate is the share of containers checked out that come back into the system. It is different from participation (how many people choose reuse) and from checkout volume (how many containers go out). A program can report strong checkout numbers and still lose containers every week.
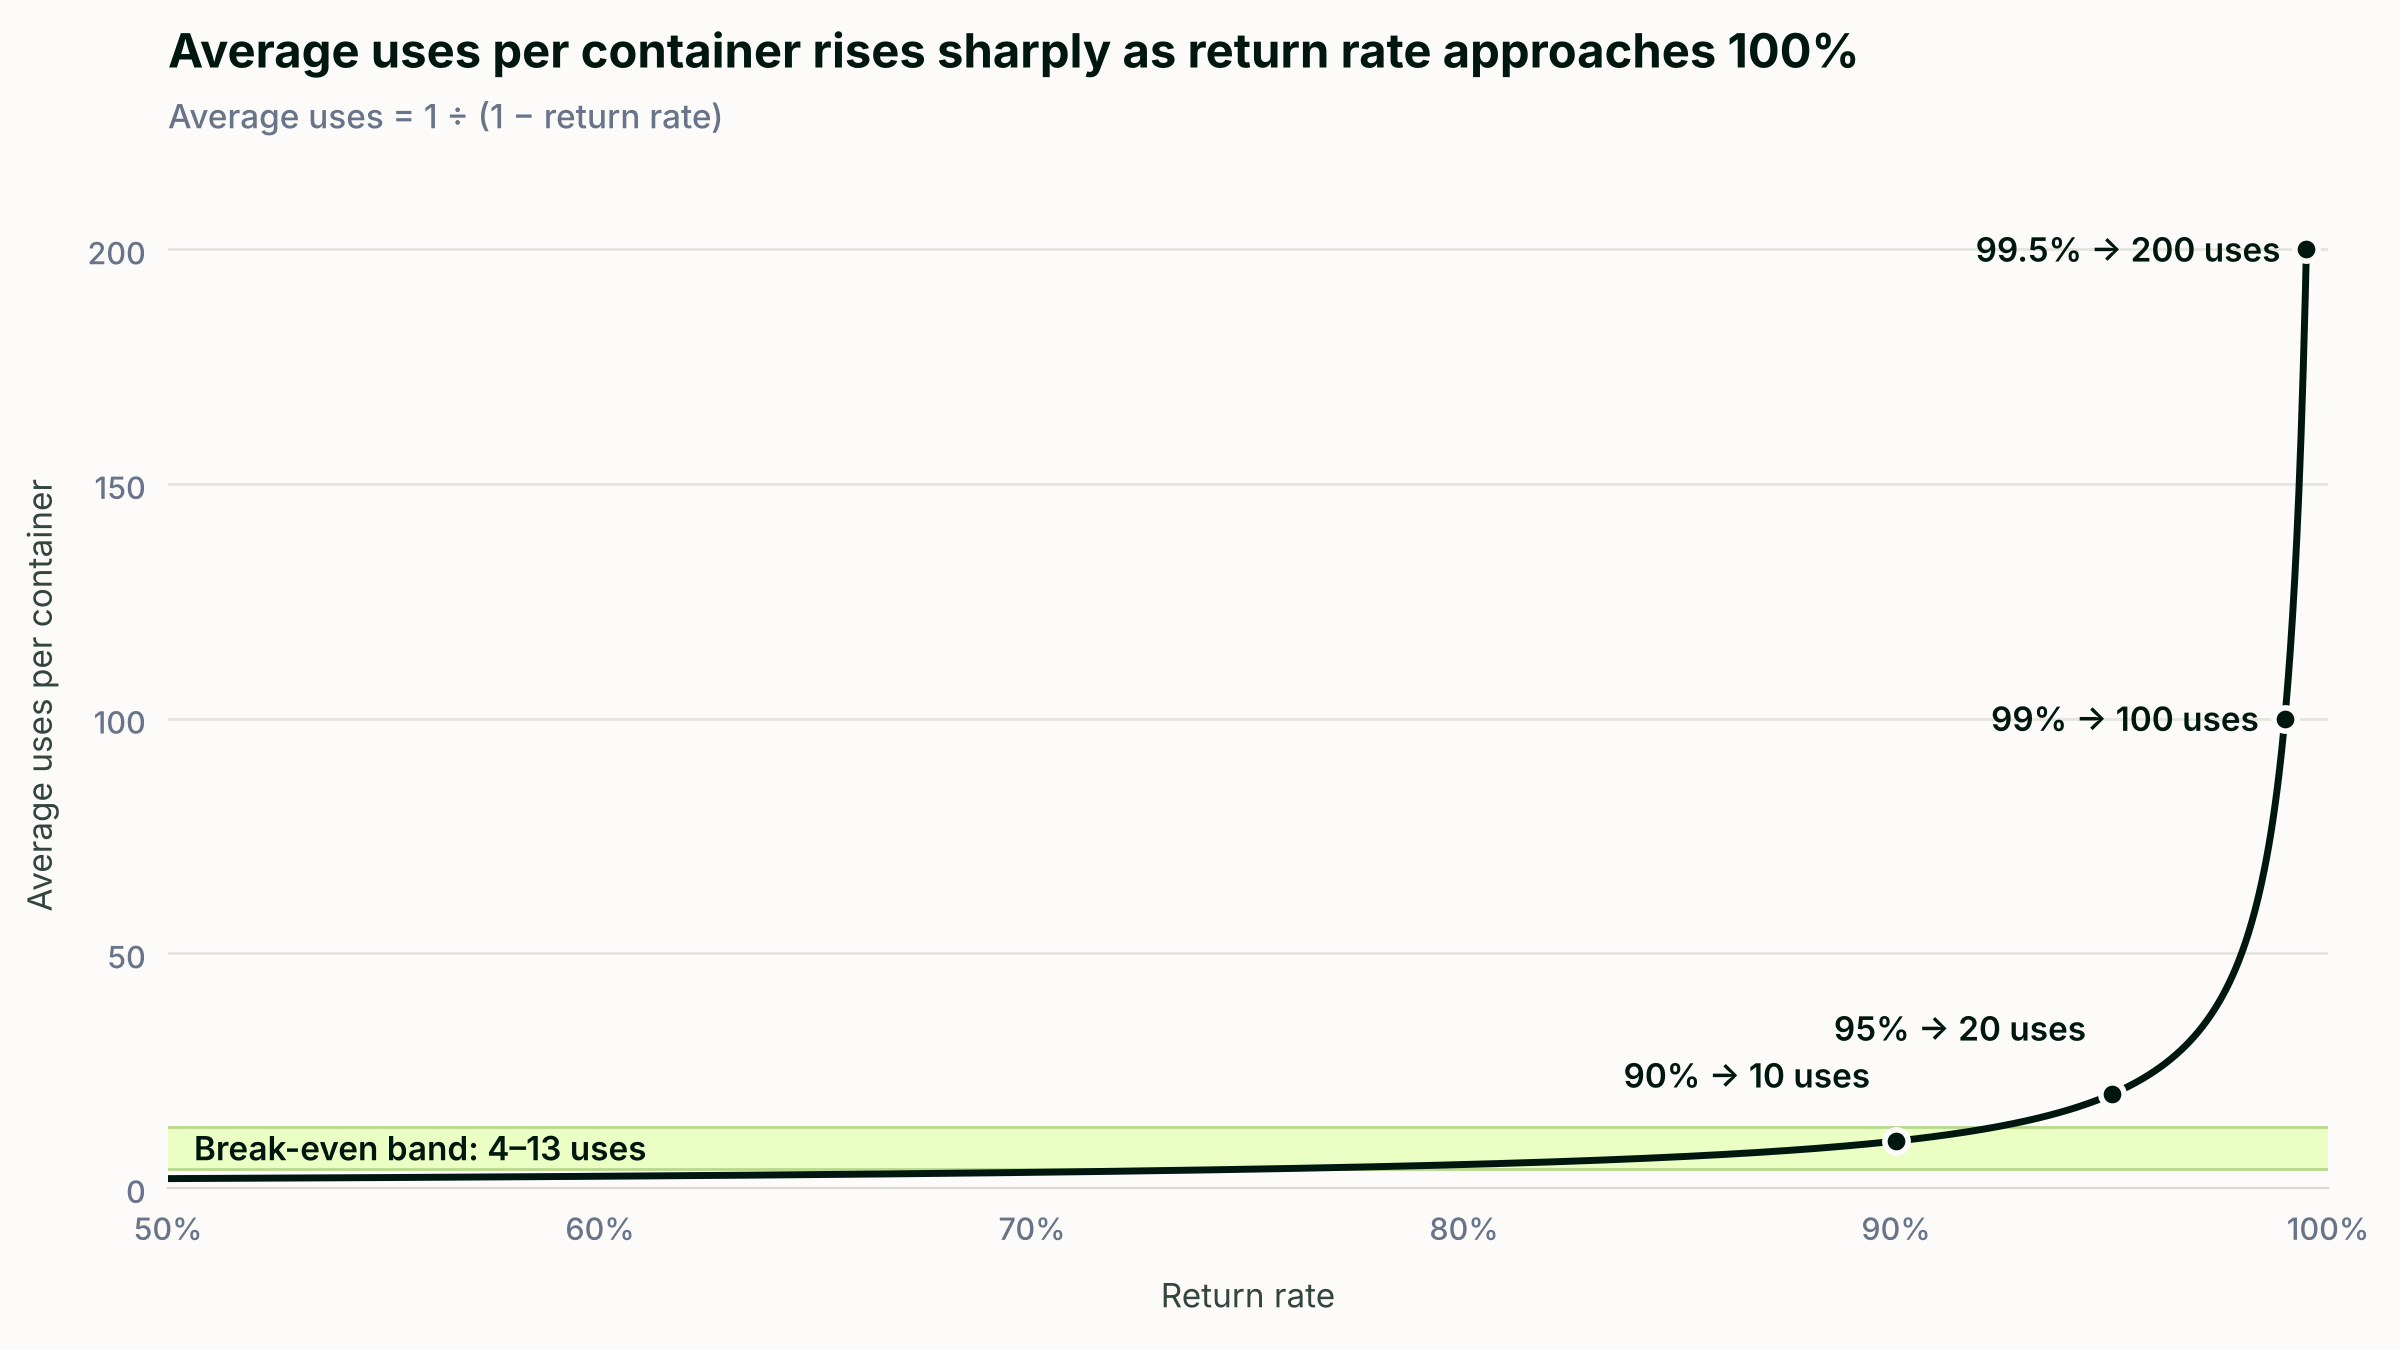
Return rate also sets how many times the average container is used. If each container has a given chance of coming back after each use, the average number of uses is 1 ÷ (1 − return rate):
| Return rate | Average uses per container |
|---|---|
| 70% | 3.3 |
| 80% | 5 |
| 90% | 10 |
| 95% | 20 |
| 98% | 50 |
| 99% | 100 |
The relationship isn't linear. Moving from 90% to 95% doubles the life of the average container. Moving from 95% to 99% multiplies it by five.
Timing matters too. A container that comes back in two days can be washed and reissued quickly; one that sits in a residence hall for a month ties up stock. Slow returns mean a program needs a larger container pool to keep service running.
The environmental case depends on it
A 2023 University of Michigan lifecycle study found that reusable takeout containers break even with single-use containers after four to 13 uses, depending on the single-use item they replace (University of Michigan, Jan 2023; published in Resources, Conservation & Recycling).
Read that range against the table above. At an 80% return rate, the average container is used about five times: at the bottom of the break-even range, and below it for some comparisons. At 95%, it is used about 20 times, well past it. An 80% return rate sounds like a good result. For a reuse program, it may not be.
The same study is a reminder that how returns happen matters as well as whether they happen. If just 5% of users made a car trip solely to return a container, the system's lifecycle greenhouse gas emissions would exceed single-use. Return points need to sit on routes people already walk.
The financial case is the same argument
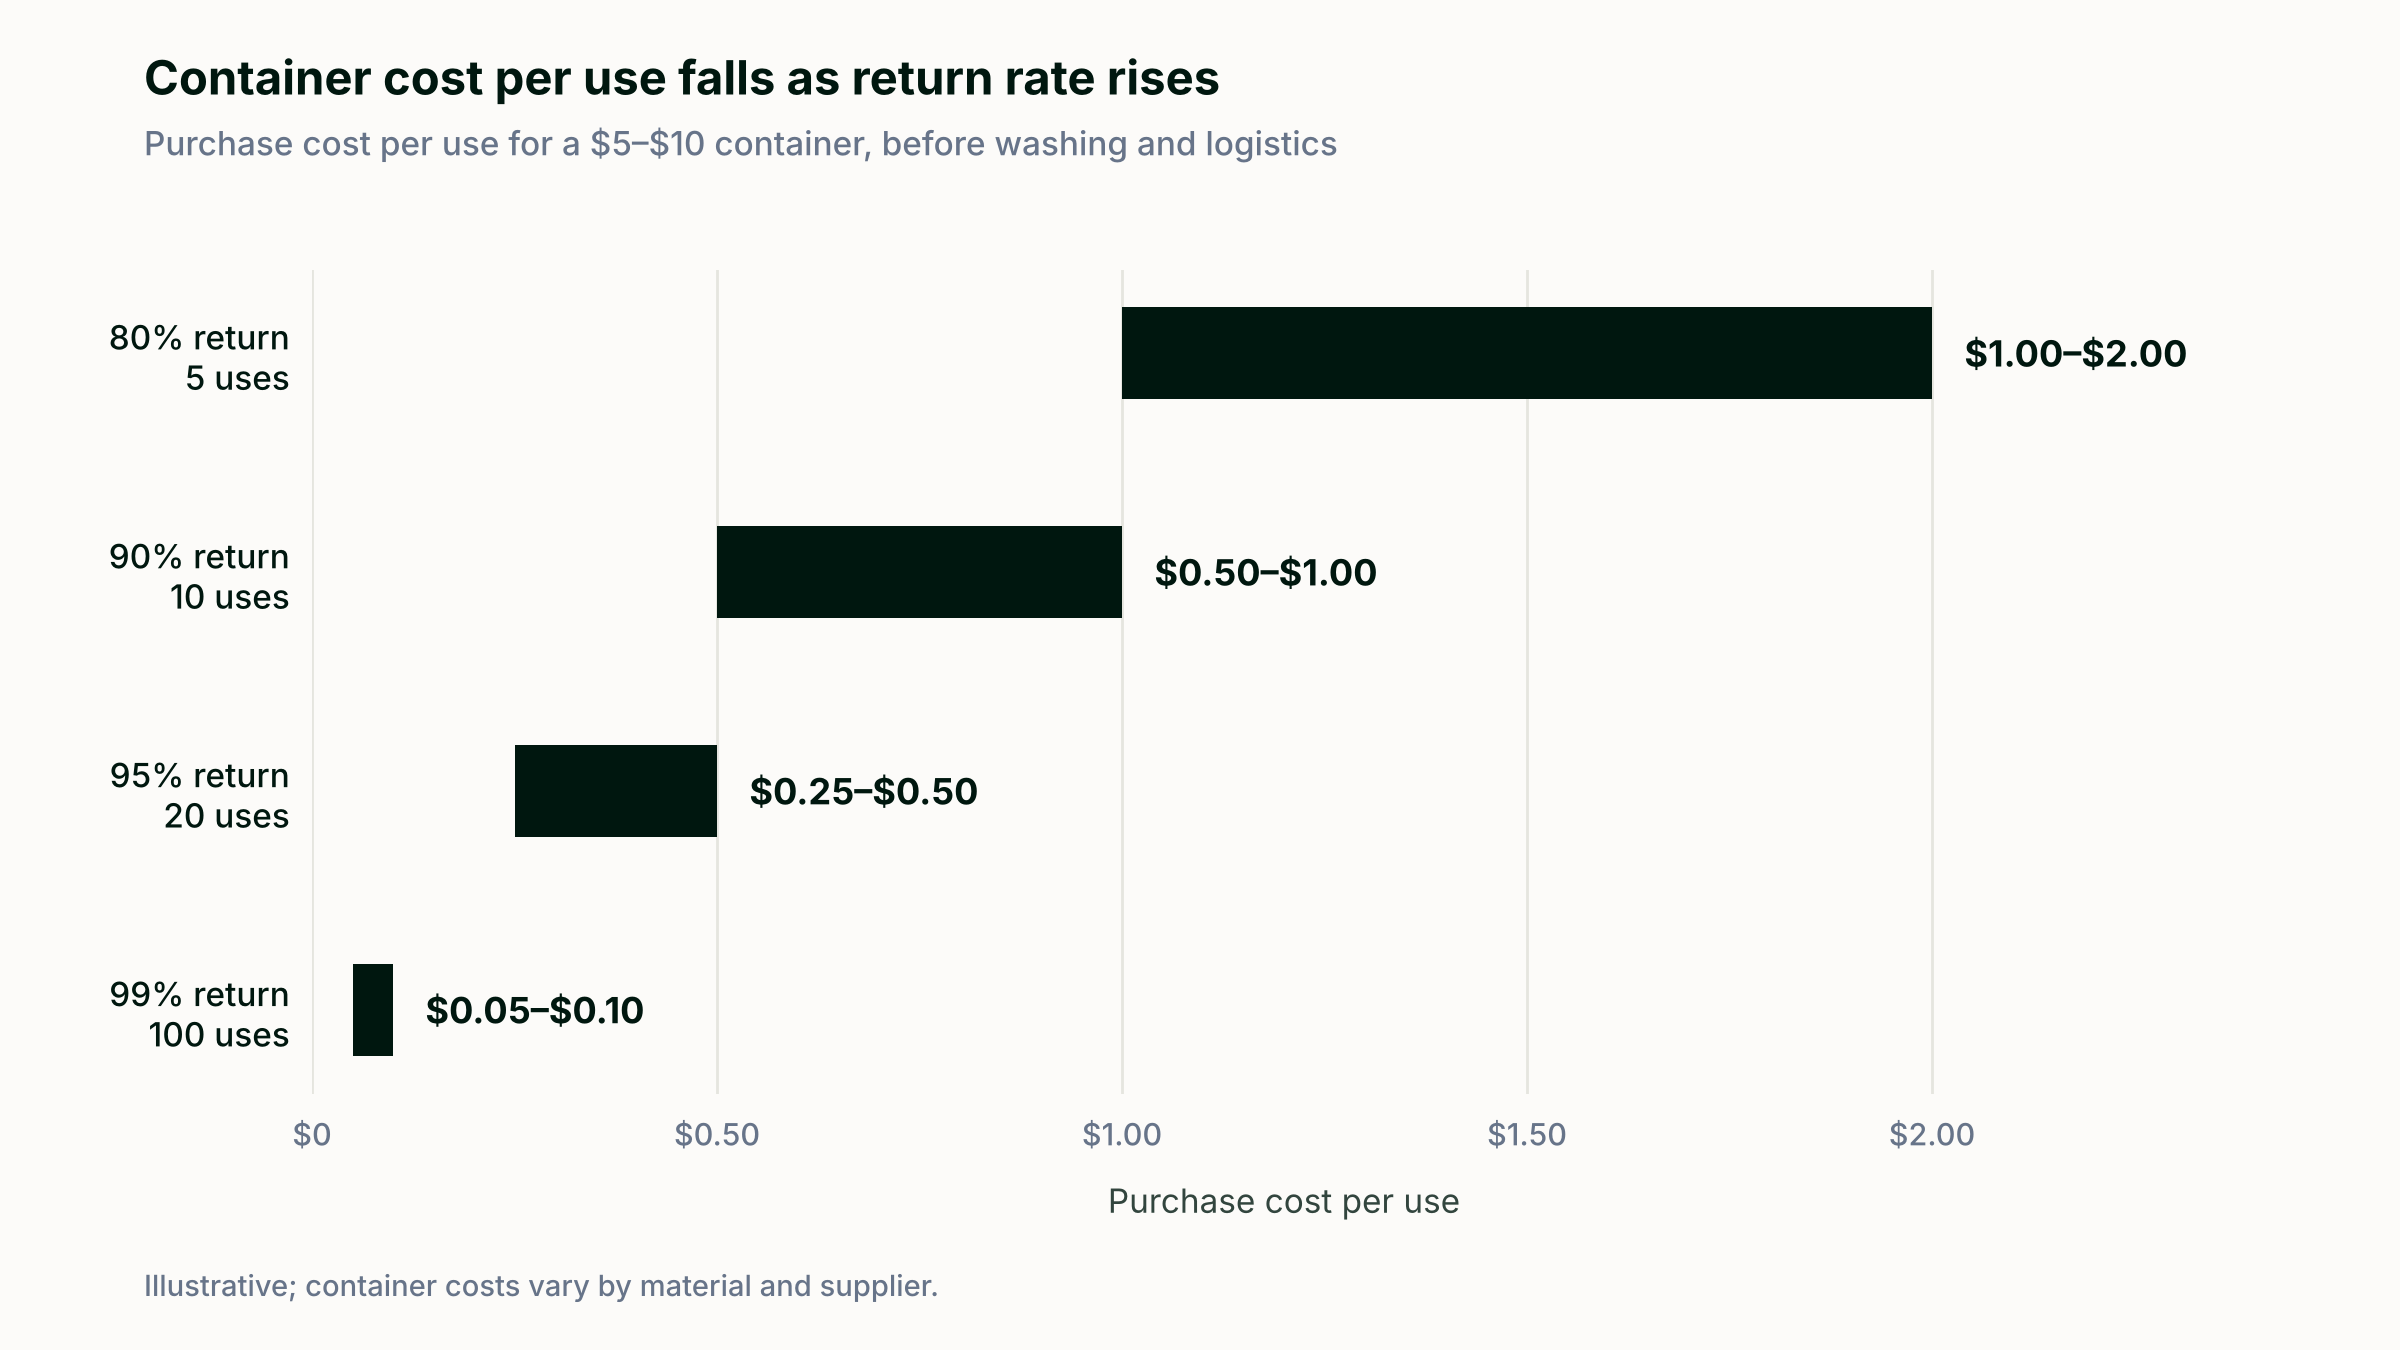
Cost works the same way. Spread the purchase cost of a reusable container over the number of times it is used, and return rate sets the result.
For a reference point, Carleton College reported paying $0.26 per single-use clamshell in 2020, and $4.10 for each reusable container it bought to replace them (Carleton College, Nov 2020). Reusable food containers typically cost between $5 and $10 each, with more durable materials such as stainless steel at the higher end.
| Return rate | Average uses | Container cost per use ($5 container) | Container cost per use ($10 container) |
|---|---|---|---|
| 80% | 5 | $1.00 | $2.00 |
| 90% | 10 | $0.50 | $1.00 |
| 95% | 20 | $0.25 | $0.50 |
| 98% | 50 | $0.10 | $0.20 |
| 99% | 100 | $0.05 | $0.10 |
Illustrative. Container purchase cost only. Washing and labor add to the cost of reuse; waste hauling and composting add to the cost of single-use. Neither is included, and prices vary by material, size and supplier.
Against a single-use container at around $0.26, a $5 reusable container matches on purchase cost only once the return rate reaches about 95%. A $10 container needs closer to 97–98%. Below that, every container that doesn't come back is a replacement cost, and replacement spending scales directly with the loss rate. For budget holders comparing reuse against single-use packaging, the comparison favors reuse only once return rates are high and stay high.
Operations break down when containers don't come back
Low return rates also show up at the service counter. When stock runs short, outlets fall back on single-use packaging, staff spend time chasing and sorting containers, and students see a program that doesn't work reliably.
A spring 2026 pilot at a U.S. university shows how quickly this can happen. According to reporting in the university's student newspaper, the program's washing facility was initially receiving about 20% of containers, and a student petition said returns had risen to 80% by February. Containers were found on benches, on the ground and in trash bins, and there was no mechanism holding anyone accountable for unreturned stock. The university ended the pilot after one semester, even though 54% of meal plan holders surveyed supported expanding it.
Demand wasn't the issue. Returns were.
What strong return rates look like, and what drives them
Strong programs do much better than 80%. Upstream, the reuse nonprofit, analyzed 32 case studies across universities, venues, events and takeout dining. Programs with a deposit, fee or incentive averaged a 96% return rate; programs relying on messaging or labeling alone averaged 86%. Among programs with no deposit or penalty, containers carrying a QR code averaged 92%, against 77% for those without, though the QR-coded containers were all in closed-loop systems, where collection is easier (Upstream, April 2026). Upstream notes the dataset is limited and context matters, but the pattern is consistent.
The mechanism matters too. Operators interviewed by Upstream reported that a charge for non-return motivates people more than a deposit paid upfront, and that timely reminders and multiple return locations do much of the work (Upstream, March 2024).
Across these sources, the factors that drive return rate are mostly design decisions rather than awareness campaigns:
- Return point placement: on everyday routes, close to where people eat.
- Item-level tracking: each container linked to a checkout, so the system knows what is out and for how long.
- Timely reminders: prompts before a container becomes overdue.
- A clear consequence: free to borrow, with a charge only if a container isn't returned.
From our own experience running campus programs, we would add one more: operator visibility. Return rate and dwell time should be reported continuously, not reconstructed at the end of term, so problems are caught while they are still small.
Reusables' Tap-to-Reuse™ system is built around these principles: borrowing is free, each container is tracked from checkout to return, and a charge applies only if a container isn't returned. As of October 2026, our return rate across all live sites is over 98%, measured over the roughly two years since our tracking began in its current format. At that rate, the average container is used more than 50 times, well past the break-even range.
Treat it as the primary KPI from day one
Return rate is the most direct measure of whether a reuse program is doing what it was set up to do. It decides the environmental outcome, the cost per use and whether service holds up.
For institutions planning or reviewing a program, that suggests three practical steps: set a return rate target before launch; ask any provider, including us, how return rate is measured and what it has been at comparable sites; and review it alongside checkout volume every month, not once a year.
Other stories you may find interesting








© Reusables™. All rights reserved.