
Stories

The Financial Case for Reusable Container Programs in University and College Dining

August 4, 2026


Single-use packaging feels like a fixed cost for university and college dining operations: cups, containers, lids, cutlery, ordered in bulk and consumed daily. But when you account for procurement, disposal, and the growing cost of waste compliance, it adds up faster than most operations teams realise.
Reusable container programs are increasingly framed as an environmental initiative. They are that, but for institutions across Canada and the United States, the financial case is often more immediate.
Where the cost is
For a mid-size university dining program serving 500,000 meals a year, single-use packaging typically runs between $0.15 and $0.50 per transaction depending on format. At the lower end, that's $75,000 annually — before disposal.
Waste disposal adds another layer. Takeout containers and cups are often contaminated with food, which disqualifies them from recycling streams. They go to landfill at a tipping fee. For high-volume sites, this is a meaningful line item.
.png)
Then there's the regulatory direction of travel. Canadian provinces and US states are increasingly introducing extended producer responsibility (EPR) legislation and outright bans on single-use foodservice items — with British Columbia, Ontario, and California among those leading the shift. Institutions that haven't built alternatives will face either compliance costs or operational disruption.
How reuse changes the math
A well-run reuse program shouldn't just eliminate cost on the surface. You're paying for containers, logistics, and washing instead of consumables and disposal. The question is whether that structure costs less at your volumes.
At institutional scale, it typically does. Single-use packaging is priced per unit. Reusable containers are a fixed capital cost, amortised over hundreds or thousands of uses. A container used 50 times costs a fraction per transaction compared to a disposable equivalent.
Return rates determine whether the model holds. At low return rates, container loss erodes the economics quickly. At high return rates — 95% and above — the model is durable.
Hollyburn Country Club in British Columbia is saving 8,000–10,000 units of paper cups, plastic lids, and takeout containers per month. The system paid for itself within roughly two months of launch.
.png)
The University of Guelph in Ontario processes over 500,000 reuses per year at a 99% return rate — a scale that makes the cost-per-use comparison with single-use packaging straightforward.
What implementation involves
The main concern institutions raise is operational complexity. Adding steps to checkout or return creates friction, and food service operations are already under pressure.
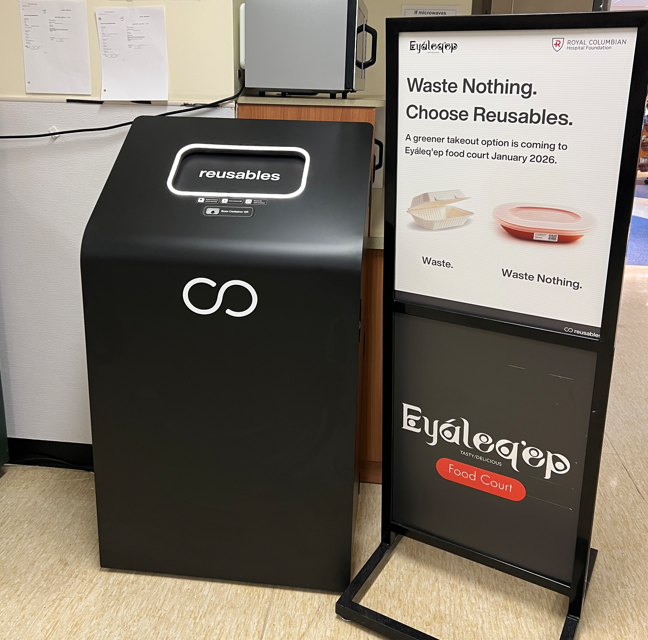
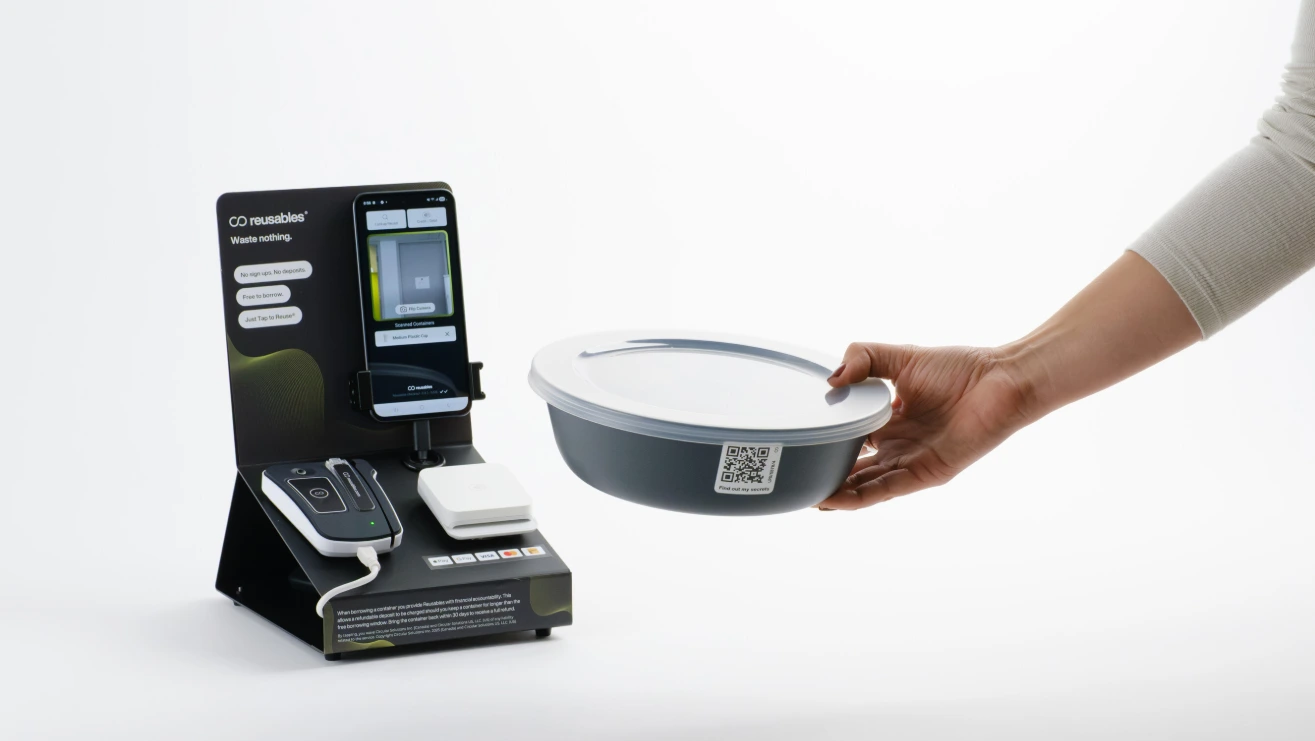
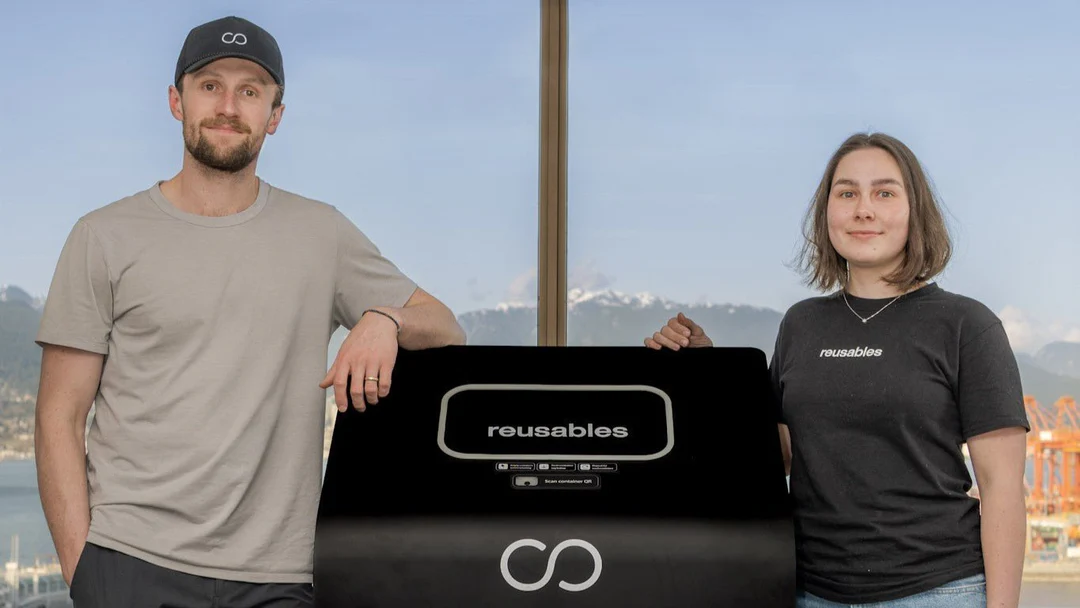
The programs that work are the ones that minimise that friction. Containers are checked out through the existing point-of-sale or student ID system — with no separate app required, no deposit collected from the patron. Returns go to Smart Return Bins placed in high-traffic locations: dining halls, building lobbies, residence entrances.
.jpg)
QR and RFID tracking handles the logistics: which containers are out, where they've been returned, when they need washing. The operations team doesn't have to count manually or chase containers.
For institutions with existing dining contracts or campus ID infrastructure, integration is typically straightforward. The program runs on top of systems already in place.
Getting to a number
The ROI calculation for a reuse program comes down to five variables:
- Current packaging spend
- Disposal costs
- Expected transaction volume
- Washing costs
- Return rate
For a university or college dining operation with meaningful takeout volume, a breakeven analysis is usually achievable within 12 to 24 months. For higher-volume sites or those in jurisdictions with elevated disposal costs, the payback period is shorter — sometimes immediate.
If you're evaluating whether a program makes financial sense for your operation, the place to start is your current packaging spend. That number, set against a projected return rate and transaction volume, gives you what you need to make the case internally.
Other stories you may find interesting
%20(1).jpg)






© Reusables™. All rights reserved.